Lean Dynamics LLC
DE
alt: 302-528-2700
PeterKin
Many companies tend to view their global supply chains as a series of independent nodes rather than as an integrated system of interconnected functions. And they manage them that way, with each piece driven by the KPIs put on them locally. Creating a supply chain map is a very good way to break out of that mindset; it will show interrelationships and wastes. The insights from such a view will highlight opportunities to optimize flows and transportation and reduce inventories.
We created such a supply chain map for a global fluoropolymers business a few years ago, and it was a real eye opener. There were millions of dollars of excess inventory; various people knew about each piece of it but no one had any idea of the whole. Our map lead to inventory optimization projects which reduced global inventory by about ten million dollars. The analysis behind the map also revealed significant breakdowns in their S&OP process, which were then corrected.
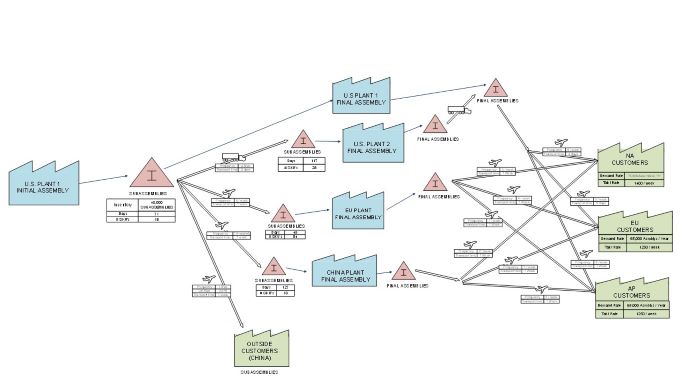
Another example, shown here, involved a global supply chain for assembled materials for use in aircraft. The map clearly illustrated the previously hidden degree of intercontinental transportation, with materials being flown back and forth between the U.S. and Europe, Europe and Asia, and Asia and the U.S. Supply chain leaders knew this was happening, but had no idea of the magnitude of the transportation waste and the excess inventory it created. The map clarified several opportunities to reduce this waste, worth millions of dollars.
Copyright 2011 Lean Dynamics LLC. All rights reserved.
Lean Dynamics LLC
DE
alt: 302-528-2700
PeterKin